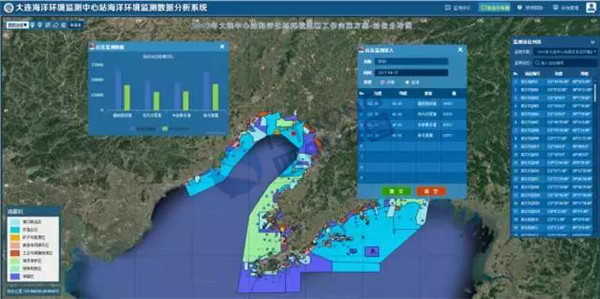
Currently, the Dalian Marine Environmental Monitoring System project, constructed by the Dalian Marine Environmental Monitoring Center Station and built by Istrong Software, has passed the final inspection. The construction unit has highly recognized this system.
The system aggregates the information hidden in disorganized data, extracts and refines it, maximizes the development of data functions, can provide leadership with data for monitoring analysis, and intuitively displays the monitoring results and actual situation.
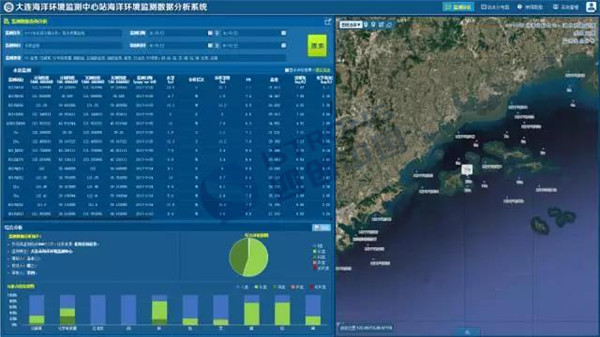
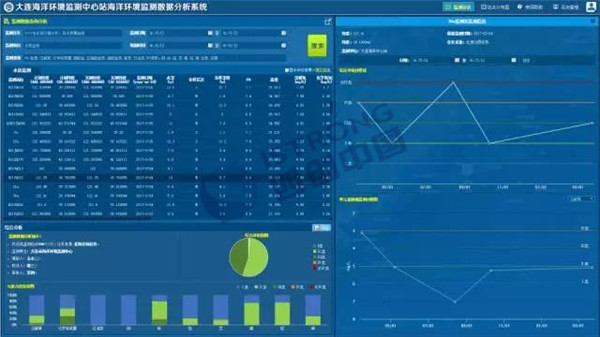
The design of this system project achieves design methods such as "one search, comprehensive analysis", so that a search for monitoring data can comprehensively analyze the retrieved monitoring data, simplify system operations, and complete system functions within three clicks.
Three aspects of work devoted to system construction
First, start from three aspects of precision, breadth, and accuracy, and advance towards decision-making assistance.
Secondly, start from the daily business, such as monthly and annual analysis reports, control of monitoring work progress, work reports, management of monitoring business, etc.
Third, analyze monitoring data, find sources of pollution, etc., to play a positive role in marine environmental governance.
The system adopts eight different methods including data reports, comprehensive analysis, site distribution, process lines, site planning, latest monitoring information, iso-surface, and emergency monitoring, fully analyzes monitoring data, intuitively displays the current status of monitoring data, and achieves "one data, eight analyses".
◆Analysis one: Data report monitoring analysis
By processing the plan year, task source, and task name, the task information is reflected with a short and clear name, plus an automatic search box, which makes it easier and faster for users to search for the tasks they need, and then view the monitoring data they need. Different monitoring projects can be viewed by category through tabs.
◆Analysis two: Comprehensive monitoring analysis
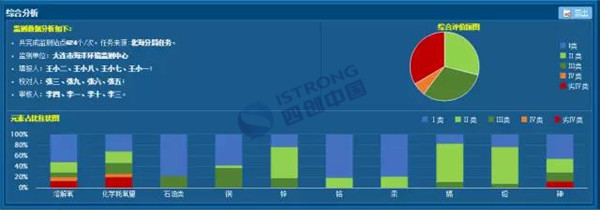
The comprehensive monitoring analysis data are displayed in various forms such as text, analysis pie charts, and element ratio advocacy charts, and a comprehensive analysis evaluation of the retrieved monitoring data is performed.
◆Analysis three: Monitoring task site distribution
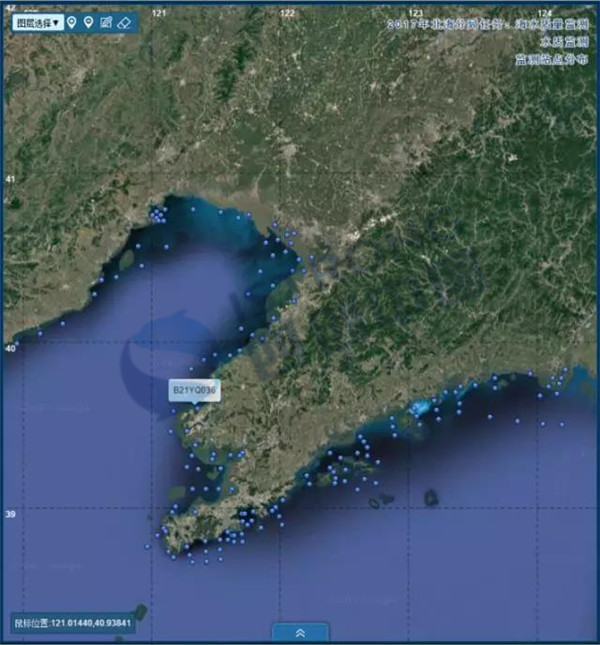
The system automatically identifies and views the retrieved monitoring data of the monitored sites on the platform, so that users can clearly understand the area and site distribution of the current monitoring tasks.
◆Analysis four: Process line analysis
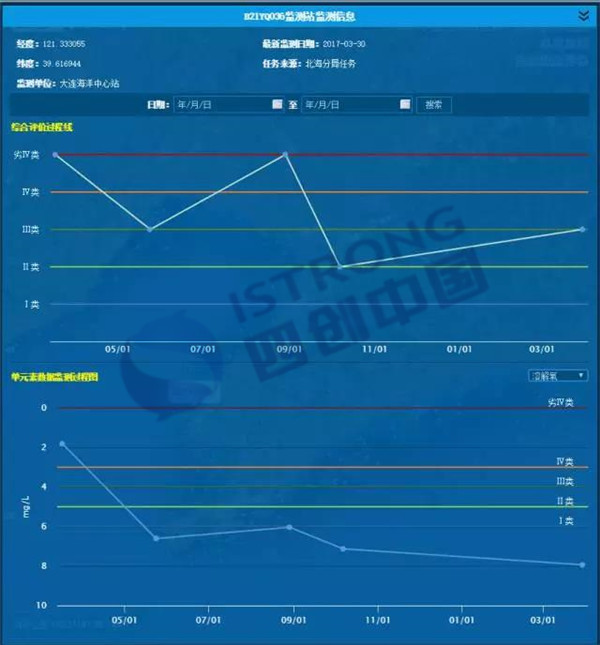
By extracting and analyzing the monitoring data of the site, a comprehensive evaluation process line and an element process line are formed. Users can intuitively view the change process of monitoring element data at each site, grasp the change law of the marine environment there, and take targeted measures to prevent and control disasters.
◆Analysis five: Site planning analysis
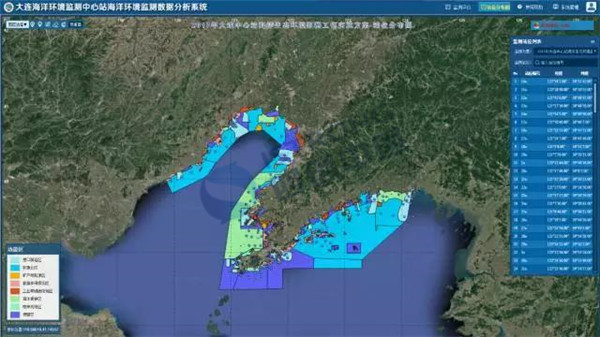
The system extracts and marks the monitoring points of each year's plan. Users can grasp the monitoring location of the entire plan and understand the functional zoning of each site.
◆Analysis six: Latest monitoring information analysis
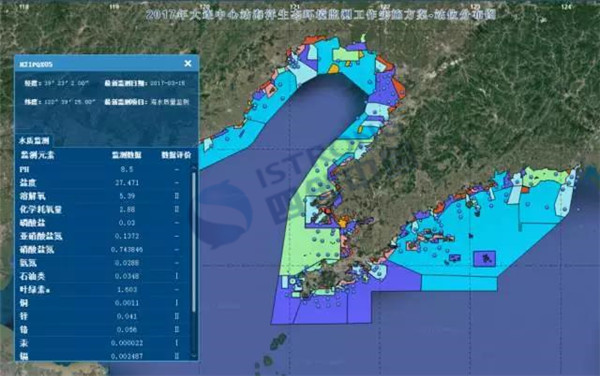
Provide the latest monitoring data and evaluation results of the monitoring site, which can facilitate customers to view the latest monitoring situation, understand the progress of the monitoring task and the results.
◆Analysis seven: Iso-surface analysis
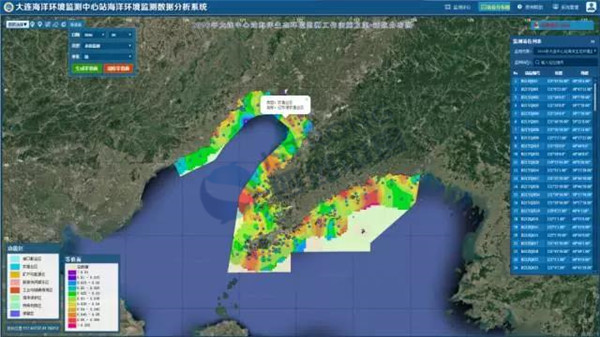
According to the conditions such as the monitoring month, type, and element selected by the user, an iso-surface of monitoring data is automatically generated on the electronic map, which intuitively displays the distribution of various monitoring data through the iso-surface, and can also click each iso-surface area to view the functional division of the area.
◆Analysis eight: Emergency monitoring analysis
The monitoring data is promptly entered into the system, and the system automatically marks the emergency monitoring points on the map. Through automatic scanning of the surrounding monitoring points and after analysis, users can intuitively view the difference between the monitoring data and the surrounding normal values.




 Home
Home
 WeChat
 400-620-1615


 Headquarters Address:ISTRONG Technology Building, Xingwang Science and Technology Park, No. 9 Gaoxin Avenue, High-tech Zone, Fuzhou
 Phone Number: +86 591-22850288
  Fax: +86 591-22850299
 E-Mail:strong@istrong.cn
 闽公网安备 35012102500164号